Is there a way to build a double digit dividend portfolio? I have mine! In this article, you will discover, step by step, how you can find strong dividend growth stocks that will make your retirement a lot more fun and safe. If you worry about your future revenues, dividend growth investing is definitely something you should look into. I suggest you bookmark this post as it’s over 3,000 words ;-).
Two weeks ago, I shared my own investing goals as follows:
#1 Adding a “stable” dividend growth stock (most likely from the consumer sector)
#2 Increase my existing positions through Dividend ReInvestment Plans (DRIP)
#3 Invest 10% of my portfolio in a US index ETF
Click here to read the rest of my 2013 investing goals. [1]
Then, I’ve asked my newsletter subscribers [2] what their 2013 dividend investing goals were. Many of you answered, thank you (I’m still busy answering email! Hahaha!) and one question really caught my attention. Here’s the email I received.
 [3]
[3]
This email gave me the idea to write this article. Many dividend investors are obviously looking for dividend growth. Some chase the highest yield dividend stocks [4], while others use DRIP and the power of compound interest to boost their dividend yield. In any case, the question is always the same:
 [5]
[5]
The concept of dividend investing is mainly based on a single fundamental aspect: business sustainability. If the company’s business model is sustainable, it will generate profits year after year. A good way to use these profits is to redistribute a part of them to investors. If you are able to find high dividend growth stocks, you will never have to worry about inflation and will withdraw a nice income stream from your portfolio at retirement. If you want to live off your dividends, you need to find these “magic” stocks.
Unfortunately, it’s easier said than done. Do you take into consideration the actual dividend growth? Past history? Future opportunities? The management team? What is most important? Payout ratio? EPS growth? Revenues? High dividend yield? These are the kinds of questions I will answer by sharing my method to find high dividend growth stocks. Here’s my step by step guide to building a strong dividend growth portfolio.
Step#1 – Forget About Double Digit Dividend Growth
So… it was all about a catchy title right? Not exactly. The reason why I called this post “Where to Find Double Digit Dividend Growth” is because this is we are all looking for, The Holy Grail. If I told you that I would show you a method to find 3% dividend growth stocks, you would have stopped reading by now. The point is not to find a 3% dividend growth stock and it’s not to find a double digit dividend growth stock either. I believe that I will enjoy much better success as an investor if I select stocks that will be able to sustainably increase their dividend each year for the next 30 years rather than trying to hit a homerun and pick a stock pushing its dividend through the roof over the next 5 years.
For example, if you look at the dividend aristocrats [6] dividend growth policy, you won’t find any double digit dividend growth stocks over the past 5 or 10 years. However, you will find 51 stocks with a 25 years + dividend growth policy behind their tie.
 [7]Mind you, if you find a double digit dividend growth stock, this means that the company has to sustain a double digit EPS growth as well. If the profit doesn’t follow the dividend payout growth, eventually it will hurt the dividend payout ratio and put at risk future dividend growth. This is why I focus on stocks that grow their dividend by more than 1% on average over the past 5 years. The goal is to pick stocks with a solid dividend growth strategy, not just the flavor of the moment.
Keep in mind that most stocks won’t increase their dividend by 8 to 10% during a recession either. So if you look at the past 5 years, you have to include the 2008 crisis when most companies had a hard time simply keeping their dividend payout as is. This is the main reason why I search for a 5 year dividend growth of at least 1%. There are some double digit dividend stocks (and I’m giving them to you later on in this post!), but you might ignore strong companies if you just look at dividend growth. You’ll see that with my method, I rarely pick a company with a small dividend growth policy and still need to keep my eyes open for opportunities!
Step#2 – Look at the Past
Now that you have realized this and won’t solely focus on dividend growth metrics, the second step to find high dividend growth stocks is to use the past to make up your mind about the present and the future. Being a strong dividend growth stock doesn’t happen overnight. It takes years of profitability and dividend growth to make sure that the company will continue on the dividend path for the future. This is why I use a stock screener for the first step of creating my list of dividend growth stocks.
I personally use FIN VIZ for the US stocks and TMX Stock Screener for the Canadian market. I made a complete list of websites for stock research here. It’s impossible to look at the entire stock market and make sound investing decisions. You can’t simply pick up just any stock paying a 4% dividend yield and pray that it will be a good choice. On the other hand, you can’t analyze hundreds of stocks before making a trade either. By using simple metrics, you can build a smaller list of stocks that already include some key characteristics to become a strong dividend payer.
a) The Metrics I use in Each Filter
Using a stock screener is one thing, pulling high quality information out of it is another. Here’s a list of metrics I use for FIN VIZ and TMX Stock Screener to build my lists.
TMX Stock Screener (Canadian + US Stocks):
The TMX Stock Screener is interesting as you can get the dividend growth… and you can get it for US stocks as well! So even if it’s a “Canadian Screener”, you can work with it to find US dividend stocks. The combination of FIN VIZ and TMX Stock Screener will definitely give you a complete list of great stock pick possibilities.
5 Year Annual Income Growth Rate: between 1 and 100 (if sales don’t go up, dividend growth will eventually be jeopardized).
Current Dividend Yield: over 3% (I think 3% is reasonable in the current economy. I sometimes cheat and look for over 3% in the hopes of picking a gem with a 2.75% dividend yield).
Return on Equity: Over 10% (I want companies that use my money to create wealth. Keep in mind that you’ll need to look inside each financial statement to see if the ROE is stable over the years).
5 Year Annual Dividend Growth Rate: Over 1% (I know that I told you that we are looking at double digit dividend growth but the crisis in 2008 creates some statistical data errors as several companies stopped their dividend growth approach during that period)
Current Price Earnings Ratio: Under 15 (I’m looking at companies that are undervalued. Since the average P/E ratio of the market is historically around 15, it’s a good start. I sometimes cheat and put 20 if I don’t get what I’m looking for)
Here’s what you get on the NYSE as at January 25th 2013:
Symbol Company Name P/E Ratio Industry Div Yield (%) ROE (%) 5 Yr Rev Growth (%) 5 Yr Income Growth (%) 5 Yr Div Growth (%)
CLF:US Cliffs Natural Resources 5.6 Metals & Mining 6.94 15.2 23.91 28.83 40.33
RCI:US Rogers Communications Inc. Cl B 16.4 Telecommunications 3.42 41.3 6.06 26.67 36.41
GES:US Guess? Inc. 11.7 Retail 3.04 18.4 8.82 5.48 33.34
WGL:US WGL Holdings Inc. 15.2 Utilities 3.87 11.1 -0.85 2.6 27.25
VALE:US Vale SA 6.8 Metals & Mining 6.60 23 12.55 10.42 25.97
DRI:US Darden Restaurants Inc. 13.1 Leisure 4.37 24.7 5.18 12.75 23
WEC:US Wisconsin Energy Corp. 15.9 Utilities 3.53 13.5 0.43 11.7 18.84
LMT:US Lockheed Martin Corp. 10.7 Aerospace/Defense 4.93 117.1 2.49 2.96 18.76
MSB:US Mesabi Trust 10.3 Financial Services 7.787 1,138.80 11.8 11.97 16.74
BCE:US BCE Inc. 14.2 Telecommunications 5.16 24.4 3.89 3.79 16.44
CHT:US Chunghwa Telecom Co. Ltd. ADS 18.3 Telecommunications 4.39 11.7 4.07 10.85 15.92
MCD:US McDonalds Corp 17.4 Leisure 3.30 39.2 4.15 19.04 15.36
NPK:US National Presto Industries Inc. 12.4 Consumer Durables 15.6633 12.6 1.15 3.35 15.21
BLX:US Banco Latinoamericano de Comercio Exterior S.A. 9.3 Banking 5.231 11.5 -8.64 3.55 14.57
RTN:US Raytheon Co. 9.7 Aerospace/Defense 3.54 21.9 3.32 1.79 14.14
WMK:US Weis Markets Inc. 13.2 Retail 3.0793 10.2 3.68 10.21 13.85
TAL:US TAL International Group Inc. 10.6 Diversified Services 6.0934 21.5 8.91 26.55 12.97
NJR:US New Jersey Resources Corp. 18.6 Utilities 3.86 11.4 -6.02 8.91 12.8
GIS:US General Mills Inc. 15.4 Food & Beverage 3.17 25.9 4.5 8.56 12.65
AZN:US AstraZeneca PLC ADS 10.1 Drugs 3.63 28.4 1.17 10.15 10.49
GNI:US Great Northern Iron Ore 4.7 Metals & Mining 28.2524 168.7 9.57 9.5 10.11
SJI:US South Jersey Industries Inc. 15.7 Utilities 3.30 14.8 -4.67 6.6 9.92
PG:US Procter & Gamble Co. 19.6 Consumer Non-Durables 3.19 16.9 0.86 1.59 9.8
WBK:US Westpac Banking Corp. ADS 14.4 Banking 6.13 13.5 14.77 7.09 9.37
SXL:US Sunoco Logistics Partners L.P. 15.2 Energy 3.84 33.1 9.68 24.29 9.22
LG:US Laclede Group Inc. 14.2 Utilities 4.3016 10.4 -10.74 0.25 8.93
TNH:US Terra Nitrogen Co. L.P. 14.7 Chemicals 6.87 209.5 2.4 6.71 8.87
CATO:US Cato Corp. Cl A 12.3 Retail 3.6996 15.9 2.05 16.51 7.93
WPZ:US Williams Partners L.P. Units 19.5 Chemicals 6.58 13.5 76.58 17.42 7.92
CVX:US Chevron 9.5 Energy 3.12 18.1 2 7.31 7.88
RAI:US Reynolds American Inc. 16.5 Tobacco 5.43 26.4 -1.33 2.72 7.8
TD:US Toronto-Dominion Bank 12.4 Banking 3.70 14.4 3.94 7.74 7.35
NEE:US NextEra Energy Inc 14.1 Utilities 3.33 13.5 -0.82 7.63 7.14
KMB:US Kimberly-Clark Corp. 18.2 Consumer Non-Durables 3.42 34 2.74 1.73 7.05
CNL:US Cleco Corp. 14.8 Utilities 3.22 11.4 3.76 9.1 6.45
K:US Kellogg Co. 17.7 Food & Beverage 3.00 48.7 2.36 3.99 6.23
RY:US Royal Bank Of Canada 12.5 Banking 3.95 19.1 -0.72 3.76 5.7
BNS:US Bank of Nova Scotia 11.2 Banking 3.93 17.7 1.27 9.21 5.64
SE:US Spectra Energy Corp 17.5 Energy 4.52 13 3.41 2.77 5.58
HNZ:US H.J. Heinz Co. 19.4 Food & Beverage 3.40 36.1 3.46 2.76 5.47
EPD:US Enterprise Products Partners L.P. 19.1 Energy 4.82 19.5 22.63 17.81 5.39
BMO:US Bank of Montreal 10.4 Banking 4.54 15.7 0.26 11.49 4.64
BTE:US Baytex Energy Corp. 19.3 Energy 5.90 21.4 16.32 4.86 4.13
OKS:US ONEOK Partners, L.P. 16.5 Energy 4.73 21.9 13.65 11.47 4.12
SJR:US Shaw Communications Inc. Cl B 14.1 Media 4.15 20.5 14.46 23.26 3.9
CPK:US Chesapeake Utilities Corp. 17.1 Utilities 3.0672 10.8 10.89 9.13 3.87
SO:US Southern Co. 17.5 Utilities 4.43 11.9 1.95 2.72 3.8
PNY:US Piedmont Natural Gas Co. 19.7 Utilities 3.67 11.7 -8.97 3.4 3.75
TCP:US TC PipeLines LP 16.4 Energy 7.20 11.2 24.23 2.57 3.7
AEP:US American Electric Power Company 13.9 Utilities 4.25 11.9 2.15 2.49 3.54
XEL:US Xcel Energy Inc. 14.7 Utilities 3.94 10.2 0.17 6.33 3.17
SON:US Sonoco Products Co. 17.4 Consumer Non-Durables 3.87 12 3 0.52 2.81
SCG:US Scana Corp. 15 Utilities 4.25 10.1 -2.61 2.24 2.43
SYY:US Sysco Corp. 16.8 Wholesale 3.55 22.6 3 2.56 2.41
PBI:US Pitney Bowes Inc. 4.1 Consumer Durables 12.35 492.6 -3.88 8.21 2.41
ALV:US Autoliv Inc. 12.3 Automotive 3.04 13.6 5.2 21.71 2.09
BPT:US BP Prudhoe Bay Royalty Trust 8.3 Energy 11.8896 25,221.50 1.07 2.03 2.03
UVV:US Universal Corp. 9.9 Tobacco 3.6907 15.4 2.64 4.26 2.01
VVC:US Vectren Corp. 15.7 Utilities 4.58 10.8 -0.81 0.62 1.95
DD:US E.I. du Pont de Nemours and Co. 16.3 Chemicals 3.58 29.4 5.11 4.8 1.65
UHT:US Universal Health Realty Income Trust 8.9 Real Estate 4.5639 42.9 28.05 30.31 1.26
BPO:US Brookfield Office Properties 7.8 Real Estate 3.33 15.1 17.76 35.59 0.89
Out of 62 stocks, you get 21 double digit dividend growth stocks and 41 stocks with a dividend growth over 5%. Keep in mind that some stocks in this list are Canadian based companies (such as banks) traded on both the TSE and NYSE.
And here’s what you get on the TSE as at January 25th 2013:
Symbol Company Name P/E Ratio Industry Div Yield (%) ROE (%) 5 Yr Rev Growth (%) 5 Yr Income Growth (%) 5 Yr Div Growth (%)
CVL Cervus Equipment Corporation 13.5 Manufacturing 3.95 11 16.26 2.8 0.23
FCR First Capital Realty Inc. 6.9 Real Estate 4.38 16.6 8.26 62.76 0.56
REI.UN RioCan Real Estate Investment Trust 6.9 Real Estate 5.22 18.1 19.31 91.51 0.81
BPO Brookfield Office Properties Inc. 7.8 Real Estate 3.31 15.1 17.76 35.59 0.89
AP.UN Allied Properties Real Estate Investment Trust 6.3 Real Estate 3.97 19.3 17.12 76.02 1
AW.UN A&W Revenue Royalties Income Fund 18.8 Leisure 6.35 16.5 N/A 4.46 1.98
GWO Great-West Lifeco Inc. 12.1 Insurance 4.67 18.3 1.66 0.01 2.8
SJR.B Shaw Communications Inc. 14.1 Media 4.08 20.5 14.46 23.26 3.9
BTE Baytex Energy Corp. 19.3 Energy 5.80 21.4 16.32 4.86 4.13
PWF Power Financial Corporation 11.2 Financial Services 4.81 27.2 1.65 0.23 4.51
BMO Bank of Montreal 10.4 Banking 4.50 15.7 0.26 11.49 4.64
BNS Bank of Nova Scotia (The) 11.2 Banking 3.90 17.7 1.27 9.21 5.64
RY Royal Bank of Canada 12.5 Banking 3.88 19.1 -0.72 3.76 5.7
VET Vermilion Energy Inc. 17.2 Energy 4.70 21.4 4.77 4.85 6.01
ACD Accord Financial Corp. 9.5 Financial Services 4.66 13.7 -0.16 6.94 6.92
AFN Ag Growth International Inc. 18.4 Diversified Services 6.88 11.9 19.08 11.57 7.17
TD Toronto-Dominion Bank (The) 12.4 Banking 3.68 14.4 3.94 7.74 7.35
T TELUS Corporation 16.9 Telecommunications 3.89 15.8 4.92 2.83 7.97
LB Laurentian Bank of Canada 9 Banking 4.37 11.4 3.47 8.05 9.39
MKP MCAN Mortgage Corporation 12.8 Real Estate 10.12 11 12.67 0.12 10.99
ALC Algoma Central Corporation 11.8 Transportation 19.18 11.3 -0.93 1.88 11.28
BDI Black Diamond Group Limited 17.7 Diversified Services 3.28 14 58.22 61.15 12.25
BCE BCE Inc. 14.2 Telecommunications 5.13 24.4 3.89 3.79 16.44
CTY Calian Technologies Ltd. 11.9 Diversified Services 5.11 20.7 4.42 9.82 23.6
RCI.B Rogers Communications Inc. 16.4 Telecommunications 3.39 41.3 6.06 26.67 36.41
Out of 25 stocks, you get 6 double digit dividend growth stocks and 14 stocks with a dividend growth over 5%.
If you combine both lists, you have roughly 80 stocks (if we subtract Canadian stocks being traded on both markets) to build your portfolio with. If you put a dividend growth minimum of 5%, you will have about 50 stocks to pick from. This is more than enough to build a strong dividend growth portfolio!
FIN VIZ (US Stocks + Some CDN Stocks trading on NYSE)
The only bad news about FIN VIZ is you can’t get the 5 year dividend growth metric. This is why I published a list from the TMX instead of FIN VIZ. It’s a good thing you can get them from the TMX stock screener! But this stock screener shows others metrics that the TMX doesn’t have… In order to a good research, you have to select other metrics to pick stocks that will show great dividend growth when you look at their financial statements. Here are the metrics I use:
Descriptive: [8]
[8]
Dividend yield: over 3%
Fundamental:
P/E Ratio: under 15
EPS Growth next 5 years: over 5%
Return on Equity: over 10%
Forward P/E Ratio: under 15
Sales Growth past 5 years: positive
EPS Growth past 5 years: over 5%
Payout ratio: under 70%
If you are looking for a complete step by step method on how to use a free stock screener, I created a walkthrough guide to FIN VIZ and TMX Stock Screener in my book Dividend Growth – Freedom Through Passive Income [8] available at Amazon [8] on both Kindle [8] and Paperback versions [8]. You will get additional information on how to build your stock list from your first screens and the next step to build your portfolio for safe and strong dividend payouts!
b) Dividend Growth History
Now that you have your list ready, it’s time to perform some deeper analysis. The process between the stock list from your screener and the in-depth analysis of a few chosen ones is not covered here as it’s a case by case scenario. Depending on the type of portfolio you have and what you are currently looking for in terms of stocks and diversification, your picks will differ greatly from another investor.
Once you’ve selected a company from your screener, the next step is to download their financial statements. If you are lucky, you will find an “Investor Fact Sheet” or “Recap” giving you some key ratios such as Earnings per Shares, Sales, Profit, and Dividend Payouts throughout the past years.
If you can’t get a hold of a one pager giving you the information right away, you’ll have to dig inside the financial statements. Take the annual reports as you will have more than one year and the info might have been calculated for you already.
When you look at the dividend growth history, it is preferable to look at the past five years. Instead of simply calculating the dividend growth annualized rate, I suggest you make a quick graph of the past 5 years dividend payout. It will give you a clear idea of which stocks have a strong dividend payout strategy compared to another. The graph can be as simple as the following:
 [9]
[9]
Which looks a lot better than the following:
 [10]
[10]
The first graph is a good indication of a solid company that is looking to increase its dividend year after year. For the record, the first graph is TRP dividend growth and the second graph is Encana dividend growth.
c) How are Sales and Earnings Per Share?
Looking at past dividend history is a good start to know if the company intends to boost its dividend in the future. But there is always a will and a way, right? So the company might have a strong dividend growth history over the past 5 years, it doesn’t mean that it is sustainable.
The relation between sales evolution and earning per shares will tell you 3 things:
How is the company’s main market doing (if sales are growing or not)
How are the company’s profits growing (are they making more profit or not)
How are the company’s margins doing (if the sales and EPS graph don’t head in the same direction, that’s a red flag or very nice news for the companies’ margin)
 [11]To ensure stable dividend growth over time, it’s obvious that you need stable sales and earnings growth. Sales growth will ensure future cash flow and earnings growth will ensure that the company makes more money as sales climb. If these two metrics are negative or growing erratically, you will need to dig deeper into the financial statements to explain it or simply pick another stock to analyze.
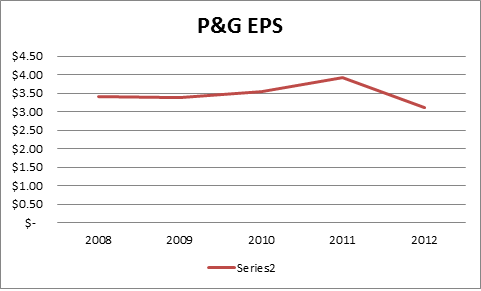
Look at Procter & Gamble (PG) [12]
example:
 [14]
[14]
As you can see right away, there is a call to action to dig deeper inside the financial statements; the sales are going up but the EPS is trailing behind. There must be something hurting the margins or special expenses that won’t happen in the future. You need to get these facts straight before you continue further and buy this stock.
However, if you look at Colgate-Palmolive (CL) [15] you will find a better trend (while not perfect):
 [16]
[16]
 [17]
[17]
Step#3 – Look at the Present
 [18]Now that you are almost burnt by your in-depth analysis, you will realize that you are only halfway in the process! Note: if picking double digit dividend growth stocks was easy, we would all be rich! Looking at the past with stock screeners and financial statements will clear most “unreliable” stocks. Now it’s time to see if this baby can keep flying. A look at the most current information about the company will give you a great hint about its ability to increase and sustain its dividend.
a) How is the Management in Place?
Something that is being ignored too often is the management team in place. Have members been there for a while and are they responsible for the good previous performances? If so, are they still on board to continue their good work and looking toward the future or simply to get their golden parachute?
Management compensation system explained in the financial statement along with the longevity of the board will help you make up your mind about their competencies. If you are lucky, you can even learn about their dividend payout philosophy for the upcoming years. If they put a lot of emphasis on their dividend in their financial statement, that’s a great sign that they will continue to push it forward.
b) What the Company’s Recent Quarters Look Like?
Besides pure metrics which have already been analyzed in Step #2, recent quarterly results will tell you if they are beating analysts’ expectations lately. In addition to analysts’ opinions, you will also see if the company is infirming or confirming their previous sales guidance. A good site to get this information quickly from is Reuters, as they usually report when companies comment their previous outlook for the upcoming year. This is a good way to interpret the present and forward results in the future.
Look for companies confirming or increasing their earnings and sales guidance for the upcoming quarters.
c) What Projects are They Currently Pursuing?
While you are looking for financial ratios within the financial statements, look for current and future projects as well. A dominating company in its sector must always look towards the future. For example, Intel (INTC) has been dominant in the PC world. However, they are experiencing problems entering in the tablet and smartphone sectors. Since PC sales are slowing down and INTC is still not able to expand into other markets, future growth will be harder to achieve and margins will be reduced.
I personally looked into INTC and saw that they are multiplying their efforts in order to build their niche into other markets. Following these current projects will tell me if INTC can successfully move from their previous business model (being the leader in processor chips for PCs) to a new business model (which not only includes tablets and smartphone but also servers and hosting services).
Step#4 – Look at the Future
 [19]From looking at past financial ratios to carefully analyzing the most recent results, you should now have a pretty good idea of where the company has been and where it’s going in the future. Unfortunately, you can’t go back into the past and buy shares 5 years ago, this why you have to project these numbers into the future to buy the right stocks.
Do You Think the Company Could Continue its Dividend Payout Strategy?
A stable evolution of sales, earnings and dividend payout ratio will answer this question. If the company has proven in the past it has the ability to generate growth and manage their earnings, chances are that their payout ratio will remain stable over time. It’s important to make your own opinion of the company instead of blindly believing what you read (even on this blog!). Your own opinion will matter during stock market slides as it will confirm or infirm your decision of holding this stock in your portfolio.
What Could Possibly Go Wrong in the Next Five Years? (and would it be bad enough to jeopardize the dividend growth?)
It’s always nice to see growth, new market and technology developments but sometimes, bad things happen too! Is the company solid enough to weather a recession? What kind of impact would a sales slowdown and pressure on margins have on the dividend payout? Is the company distributing all their profits (i.e. high dividend payout ratio) or is there room for bad luck?
Once you reach this point and ask these questions, you should be able to find the answer easily within the analysis you already made. This is why it is so important to have your own opinion and facts to back it up.
Step#5 – Review Your Stock Once a Year
 [20]When you pick a stock and make money with it throughout the year, it doesn’t mean that you will continue to make more in the future. Reviewing your stock holdings once a year is a must to make sure your companies show similar metrics and you still hold them forthe reasons why you have picked them in the first place.
The stock market evolves rapidly and it’s important to make the difference between “noise” and the company fundamentals. As a last piece of advice, I would suggest avoiding falling in love with a stock. Don’t think that a bad company will rebound and don’t expect “good picks” to be good forever.
If you follow these steps for each stock you buy, chances are that you will be building double digit dividend growth portfolio over time. Always keep in mind that you are better off with a strong company with a 5% dividend growth than a double digit dividend growth stock with shaky fundamentals.
If you are looking for more help to manage your portfolio and optimize your tax situation, you can purchase my book on Amazon (click here for more info).
 [8]
[8]
This is the Best dividend Investing book your will EVER buy…
Here’s an excerpt of a review on Amazon [21] (click on the link to read the review if you don’t believe me 😉 )
Great book – Mike (the author) is the reason I’m a dividend investor today. A guru in the dividend investment world.
Google+ [22]