
Many investors like to keep things simple and use the payout ratio as a quick filter to determine if a company can afford to share the wealth with its shareholders. It often looks like this:
-
Payout ratio under 80% = dividend is safe
-
Payout ratio above 80% = dividend is unsafe
That shortcut is a bad use of the payout ratio.
Yes, the payout ratio is a valuable indicator of dividend sustainability. But you can’t take a number from a stock screener or finance site and draw a solid conclusion. Context is everything.
This post will show you how to add that context, understand different types of payout ratios, and use them wisely—without throwing away great opportunities.
How Payout Ratios are Calculated
The classic calculation is straightforward:
Dividend per Share ÷ Earnings per Share

Sounds simple, but here’s the first trap—are those earnings quarterly, annual, or trailing twelve months? Different sites use different periods.
Look at Royal Bank (RY.TO) during 2020’s pandemic shock:
-
Oct 2019: EPS $2.18 / Dividend $1.05 = 48%
-
Jan 2020: EPS $2.40 / Dividend $1.05 = 44%
-
Apr 2020: EPS $1.00 / Dividend $1.08 = 108%
-
Jul 2020: EPS $2.20 / Dividend $1.08 = 49%
-
TTM: EPS $7.78 / Dividend $4.26 = 55%
If you looked only at April 2020, you’d think “uh-oh.” But in context, it was a one-off caused by a big provision for credit losses—a paper reserve, not an actual loss. Royal Bank’s ability to pay its dividend was never really threatened.
You can obtain additional perspective when you analyze the pandemic’s affect on Royal Bank’s payout ratios temporarily. In the following graph, you will notice how a bad quarter with weak earnings could completely change the payout ratio. Fortunately, not all economic events come with a permanent impact.
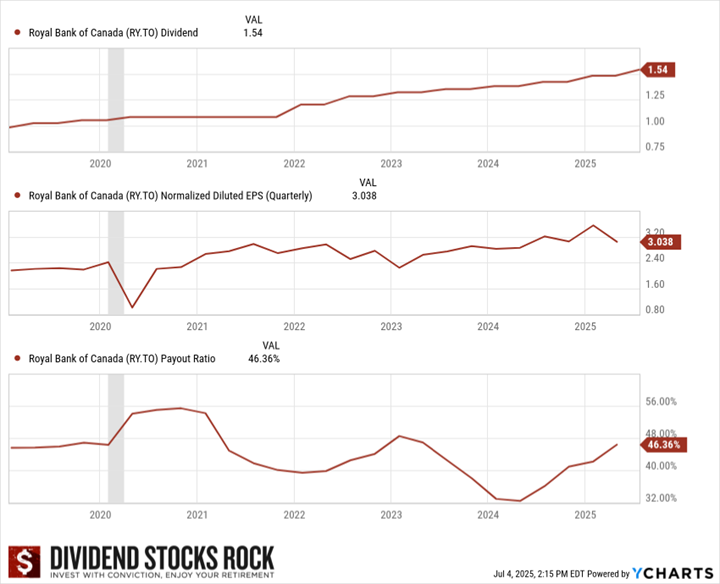
The lesson: a single quarter can distort the picture. Always look at the longer trend and, when something odd pops up, check the quarterly reports for the explanation.
Trends Are Your Friends
A single number doesn’t mean much. At first glance, Royal Bank’s 40–50% payout ratio looks fine. But what if it has historically been closer to 35%? Or 60%? Trends tell the story.
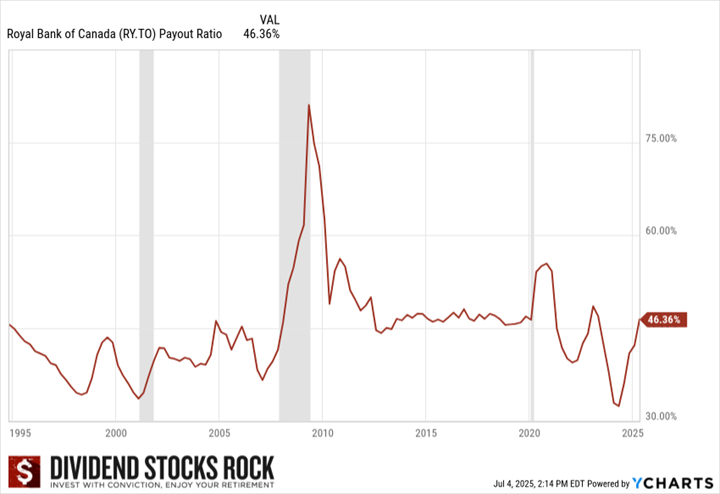
In Royal’s case, payout ratios have usually stayed under 50%, rising into the low 60s during recessions. The only times it’s been higher were during 2008–2010 and the COVID quarter we just saw. Knowing that historical “normal” makes it easier to judge current levels.
You can repeat this exercise with any company. Compare the ratio to its own history, not some arbitrary universal rule.
What Is a “Good” Payout Ratio?
In an ideal world, under 80% leaves room for dividend growth and reinvestment in the business. But that ideal varies by industry:
-
Canadian banks and utilities: often target 45–50%
-
Tech companies: might be 15–30%, preferring to reinvest heavily
-
Cyclicals like 3M: fluctuate with the economy, sometimes hitting 75–80% in slowdowns
3M is a cautionary tale. Once a Dividend King with 60+ years of hikes, it spun off a business in 2024 and cut its dividend. Its payout ratio had been creeping higher for years, often above its “golden years” 40–60% range. The trend told the story before the cut happened.
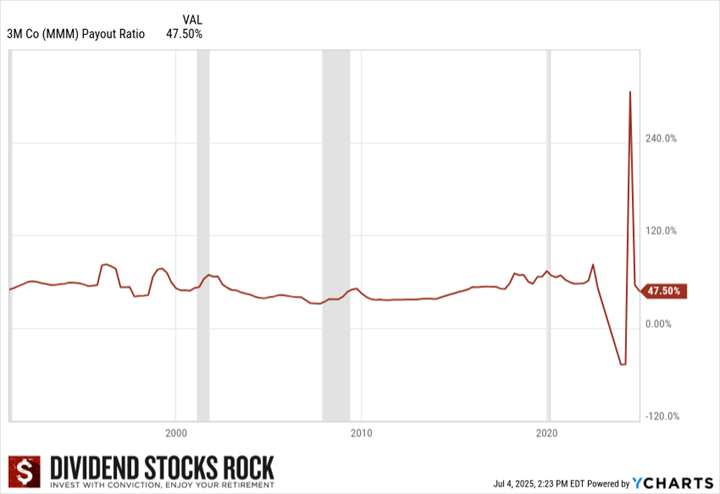
My sweet spot is 25–80%, but I don’t automatically discard companies outside it. A high ratio is a flag, not a guillotine.
When 100%+ Isn’t the End of the World
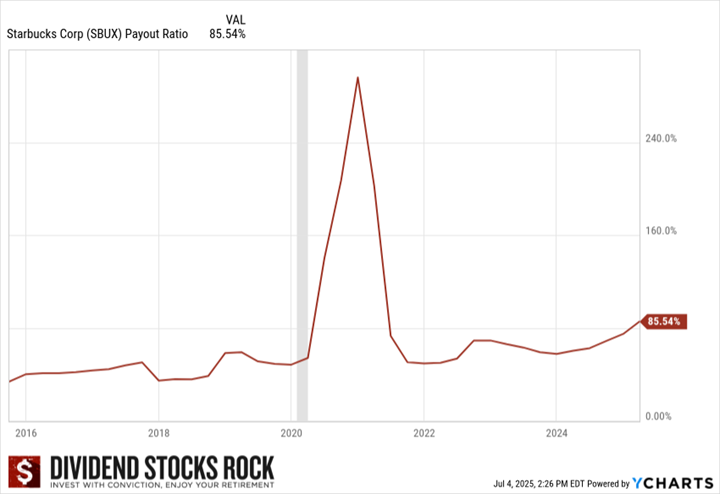
A payout ratio over 100% means the company paid more in dividends than it earned (EPS basis) or than it generated in cash (cash basis). That’s rarely sustainable forever, but sometimes it’s a temporary blip.
Starbucks (SBUX) saw its payout ratio spike to 296% in 2020 when lockdowns shuttered stores. Once they reopened, earnings normalized and so did the ratio. The dividend was never cut.
Industry Nuances and Alternative Ratios
Some sectors look bad under the classic EPS-based ratio because of big non-cash expenses or capital projects. That’s why other payout ratios exist:
-
Cash Payout Ratio: Dividends ÷ (Cash Flow from Operations – CAPEX – Preferred Dividends). Better for capital-intensive companies, but can still look ugly during big build-outs.

-
Distributable Cash Flow (DCF) Payout Ratio: Used by pipelines and utilities; strips out heavy depreciation that depresses EPS.
-
Funds from Operations (FFO) Payout Ratio: Used by REITs; gives a truer sense of cash available for distributions.
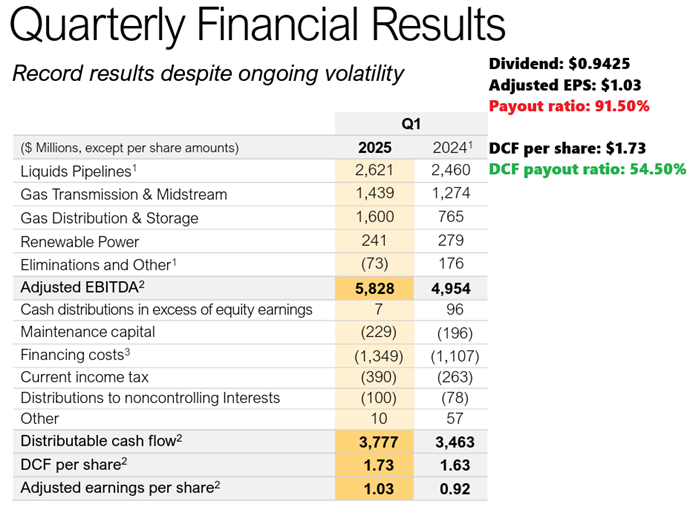
Enbridge (ENB.TO) is a great example. On an EPS basis, its payout ratio is often over 100%.
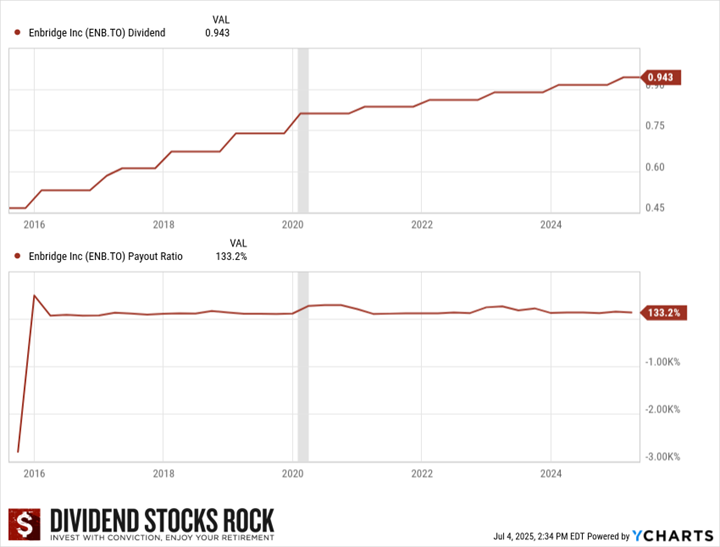
Using DCF, it’s closer to 65–70%, which is within its target range. That doesn’t mean you ignore the high EPS ratio—capital-intensive firms still face debt and interest rate risks—but it shows why you must know the right metric for the business model.
Negative Payout Ratios
If EPS is negative, the classic payout ratio is negative. If free cash flow after CAPEX is negative, the cash payout ratio can be negative too. This often happens in:
-
Capital-intensive build-outs (e.g., BCE or Verizon rolling out 5G)
-
One-time accounting charges (asset write-downs, lawsuit settlements)
Again, investigate the cause. If it’s a temporary investment phase or a one-off write-down, it may not threaten the dividend. If it’s chronic unprofitability, that’s a different story.
Why I Don’t Use Payout Ratios as a Primary Filter
If you set your screener to only show payout ratios between 30% and 80%, you’ll slash your list—but you’ll also throw out some great businesses. In July 2025, a strict filter like that would have excluded AbbVie, Broadcom, Brookfield, and Costco, all for reasons unrelated to their actual ability to pay.
AbbVie (ABBV) 264%: For Q1 2025, the GAAP EPS was $0.72 while the adjusted EPS was $2.46. You can see the immense difference.
Analog Device (ADI) 110%: Same thing for ADI: the GAAP EPS was $1.14, and the adjusted EPS was $1.85.
Broadcom (AVGO) 159%: The company is known for making acquisitions that impact EPS and carry amortization, which is a non-cash element affecting earnings.
Brookfield Infrastructure (BIPC / BIPC.TO) 4,400%: The company uses funds from operations as its earnings are affected by acquisitions and amortization.
Brookfield Corp (BN / BN.TO) 105%: The company uses distributable earnings for payout ratios.
Costco (COST) 116.59%: The high payout ratio is often driven by the special dividend.
Telus (T.TO / TU): The company’s CAPEX is killing its payout ratios.
At DSR, we start with the Dividend Triangle—revenue growth, earnings growth, and dividend growth. Then we check payout ratios as a secondary step, digging deeper when something looks high or low.
In conclusion, I’d say a payout ratio over 100% is not sustainable if:
- You are using the “right” payout ratio calculation
- The payout ratio remains over 100% for a long period of time
The company doesn’t show the ability to grow its revenue and earnings (or cash flow) in the coming years.
Ready to Find Dividend Growers with Healthy Payout Ratios?
 The Dividend Rock Star List is built on the Dividend Triangle—revenue growth, earnings growth, and dividend growth—so you can quickly spot companies with the strength to keep raising payouts year after year.
Every stock on the list is rated for safety and growth potential, making it the perfect place to start your research after mastering payout ratio analysis.
Key Takeaways
-
Context is everything – Look at trends, compare to the company’s own history, and understand industry norms.
-
Know the right metric – Use DCF or FFO for pipelines, utilities, and REITs; cash payout for capital-intensive businesses.
-
Investigate anomalies – One bad quarter doesn’t doom a dividend, but a persistent high or negative ratio demands answers.
-
Use it as a second screen – Let the Dividend Triangle guide you first, then use payout ratios to confirm or question your picks.
A payout ratio over 100% isn’t automatically bad news, but if it’s calculated correctly, stays that high for years, and the company isn’t growing revenue or earnings, the risk of a cut is real.
The payout ratio is a good indicator of dividend sustainability; let me explain how to use payout ratios wisely when assessing companies as potential investment opportunities or when considering whether to sell.


Thanks for the article. So, using what you said above, ZIM would be a good example of a bad payout ratio? They offered insane dividends and for a while it was good money but I knew it was unsustainable and they cut their dividends. I sold shortly after that.
You got it right!
I’ve been asked about ZIM in 2021 and explained that the dividend wasn’t sustainable. A great yield is not the only thing that matters 🙂